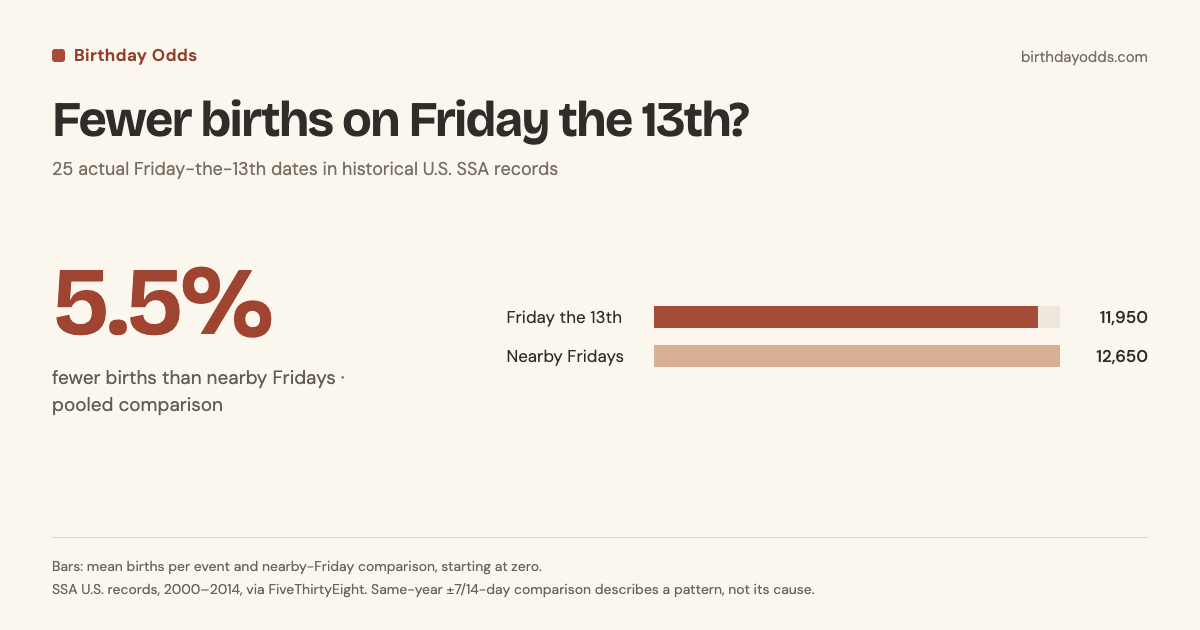
Friday the 13th had fewer recorded births than nearby Fridays in these historical U.S. data. Across 25 actual occurrences from 2000 through 2014, SSA recorded an average of 11,950 births on the date. Nearby Fridays in the same years averaged 12,650.5: Friday the 13th had 5.5% fewer.
The lower count appears in 24 of the 25 individual comparisons and in every year's pooled comparison. Choosing different nearby Fridays changes the size of the gap and the one apparent exception. These counts do not tell us why a delivery happened on a particular date.
Fewer births on Friday the 13th?
25 actual Friday-the-13th dates in historical U.S. SSA records
Bars: mean births per event and nearby-Friday comparison, starting at zero. SSA U.S. records, 2000–2014, via FiveThirtyEight. Same-year ±7/14-day comparison describes a pattern, not its cause.
How did each year compare?
We followed every actual Friday the 13th in the SSA series, rather than choosing one fixed month/day. For each event, we averaged the available Fridays one and two weeks before and after it in the same year.
Each annual row combines that year's actual occurrences. A negative percentage means Friday the 13th had fewer births than its nearby Friday average.
| Year | Friday-the-13th dates | Average recorded births | Nearby Friday mean | Difference |
|---|---|---|---|---|
| 2,000 | 1 | 11,723 | 12,655.8 | -7.4% |
| 2,001 | 2 | 11,534 | 12,599.6 | -8.5% |
| 2,002 | 2 | 12,314 | 12,847.5 | -4.2% |
| 2,003 | 1 | 12,013 | 12,912 | -7.0% |
| 2,004 | 2 | 12,012 | 12,742.1 | -5.7% |
| 2,005 | 1 | 11,803 | 12,805.8 | -7.8% |
| 2,006 | 2 | 12,311 | 13,299.4 | -7.4% |
| 2,007 | 2 | 12,698 | 13,455.6 | -5.6% |
| 2,008 | 1 | 12,394 | 13,393.8 | -7.5% |
| 2,009 | 3 | 11,886 | 12,353.9 | -3.8% |
| 2,010 | 1 | 12,092 | 12,688 | -4.7% |
| 2,011 | 1 | 11,125 | 11,917.5 | -6.6% |
| 2,012 | 3 | 11,466.3 | 11,957.2 | -4.1% |
| 2,013 | 2 | 12,076.5 | 12,409.8 | -2.7% |
| 2,014 | 1 | 11,651 | 12,247.5 | -4.9% |
The annual comparison was lower in all 15 years. Years can contain different numbers of Friday-the-13th dates, so the full-period result pools event counts against event comparison means; it is not an unweighted average of the annual percentages.
Was every Friday the 13th below its nearby Fridays?
Under the main one-and-two-week comparison, November 13, 2009, is the exception. One of its controls is November 27, the Friday after Thanksgiving. That unusually quiet comparison date lowers the nearby average enough for November 13 to appear above it.
| Date | Recorded births | Nearby Friday mean | Difference |
|---|---|---|---|
| 2000-10-13 | 11,723 | 12,655.8 | -7.4% |
| 2001-04-13 | 10,881 | 12,274.3 | -11.4% |
| 2001-07-13 | 12,187 | 12,925 | -5.7% |
| 2002-09-13 | 13,028 | 13,499.8 | -3.5% |
| 2002-12-13 | 11,600 | 12,195.3 | -4.9% |
| 2003-06-13 | 12,013 | 12,912 | -7.0% |
| 2004-02-13 | 11,749 | 12,467.3 | -5.8% |
| 2004-08-13 | 12,275 | 13,017 | -5.7% |
| 2005-05-13 | 11,803 | 12,805.8 | -7.8% |
| 2006-01-13 | 11,994 | 13,009.3 | -7.8% |
| 2006-10-13 | 12,628 | 13,589.5 | -7.1% |
| 2007-04-13 | 12,168 | 12,810.3 | -5.0% |
| 2007-07-13 | 13,228 | 14,101 | -6.2% |
| 2008-06-13 | 12,394 | 13,393.8 | -7.5% |
| 2009-02-13 | 11,832 | 12,692.8 | -6.8% |
| 2009-03-13 | 12,087 | 12,858 | -6.0% |
| 2009-11-13 | 11,739 | 11,511 | +2.0% |
| 2010-08-13 | 12,092 | 12,688 | -4.7% |
| 2011-05-13 | 11,125 | 11,917.5 | -6.6% |
| 2012-01-13 | 11,380 | 11,827.3 | -3.8% |
| 2012-04-13 | 10,910 | 11,405.8 | -4.3% |
| 2012-07-13 | 12,109 | 12,638.5 | -4.2% |
| 2013-09-13 | 12,669 | 12,876 | -1.6% |
| 2013-12-13 | 11,484 | 11,943.5 | -3.8% |
| 2014-06-13 | 11,651 | 12,247.5 | -4.9% |
The November 13 birthday page uses only November 6 and November 20 for its main comparison, avoiding Thanksgiving Day and the Friday after it. Under that comparison, November 13, 2009, is below its nearby Fridays. A fixed-date birthday rank and a study of all Friday-the-13th occurrences are different questions.
Does the result depend on the control dates?
Using only the Fridays one week away gives 6.4% fewer births on Friday the 13th. Using only those two weeks away gives 4.6% fewer. Both retain a lower pooled count.
We also predefined a holiday-window sensitivity: remove comparison dates within one calendar day of New Year's Day, Independence Day, Christmas Day, or the actual Thanksgiving date. Keep all Friday-the-13th event dates, and recalculate each event's comparison average using its remaining controls.
That removes 3 control dates: November 29, 2002; November 27, 2009; and November 29, 2013. All were the Friday after Thanksgiving. With them removed, the pooled difference is 6.4% fewer births, and all 25 events are below their comparison.
| Comparison | Nearby Friday mean | Difference | Events below comparison |
|---|---|---|---|
| One and two weeks either side | 12,650.5 | -5.5% | 24 of 25 |
| One week either side | 12,765.4 | -6.4% | 25 of 25 |
| Two weeks either side | 12,530.1 | -4.6% | 22 of 25 |
| Remove predefined holiday-window controls | 12,763.6 | -6.4% | 25 of 25 |
The exclusion list does not cover every holiday or remove every seasonal influence. Its purpose is to show whether a few holiday controls change the comparison. January 13 events also use fewer two-week controls because a date in the prior December is outside our same-year rule.
Does superstition cause fewer Friday-the-13th births?
The daily SSA records contain birth totals, not parents' beliefs, delivery methods, or hospital schedules. A lower count cannot establish a cause or tell us how many births were moved to other dates.
Earlier work already identified this pattern. A 2016 methodological discussion at Columbia describes FiveThirtyEight's comparison of the 13th with the 6th and 20th. A separate birthday-selection study found a stronger drop on Friday the 13th than on other 13ths in Virginia records from 2005 through 2014 and Nevada records from 2002 through 2011. Those analyses use different populations or comparison choices.
The tables above follow SSA events through individual years and show what changes when holiday controls are removed. They describe birth counts; they do not test whether the date brings bad luck.
Sources and calculation limits
We used 62,187,024 recorded SSA U.S. births compiled by FiveThirtyEight, covering 5,479 dates from 2000 through 2014. This is narrower than the combined 1994 through 2014 ranking used by the birthday checker.
The percentages describe these records against selected comparison dates. Different controls give different magnitudes, and this historical window cannot tell us how large the gap would be in future years. The results are not causal estimates or worldwide birth rates. The day-of-month study asks about all 13ths, and the weekday study supplies broader weekday context.
Download every event and control, or read the methodology for source coverage.