For two non-twin siblings born in different years, the familiar 1-in-365 answer is an independent-birthday benchmark, not a measured rate for real families. It assumes their month/day birthdays are independent and equally likely across 365 dates, excluding February 29.
Using the historical U.S. birth shares instead gives about 1 in 364 under the same independence assumption. Neither model tells us how often actual siblings share a birthday. Our daily birth records cannot identify which children belong to the same family.
Siblings sharing a birthday
An independent-draw benchmark, not an observed sibling rate
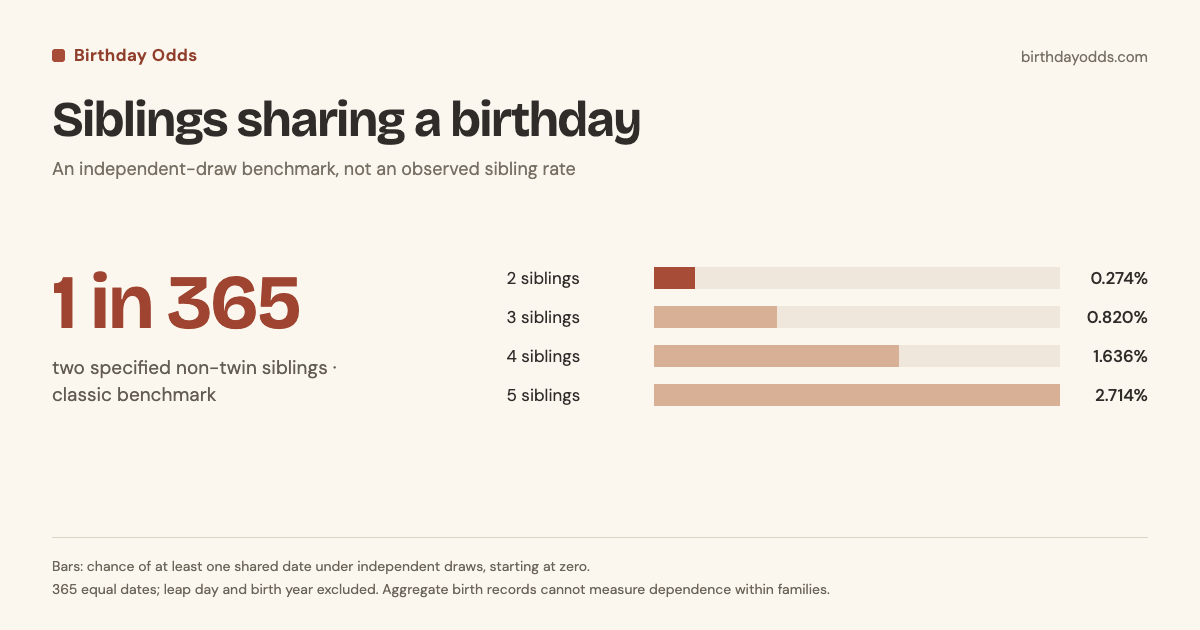
Bars: chance of at least one shared date under independent draws, starting at zero. 365 equal dates; leap day and birth year excluded. Aggregate birth records cannot measure dependence within families.
Why is the simple benchmark 1 in 365?
The first sibling can have any birthday. The second needs to match that date. If every supported date is equally likely, that chance is 1/365. Their different birth years are already given; the question asks only whether their month and day match.
Multiplying 1/365 by 1/365 would instead require both children to have one particular date chosen beforehand. It is unnecessary when any shared date qualifies. The Harvard birthday-problem solution explains the difference between matching a particular person's birthday and finding a match anywhere.
The model does not calculate pregnancy timing, the interval between births, or the chance of children being born in particular years. Twins and other multiple births are outside this independent-draw benchmark.
Matching the hour or minute of birth would make the event more specific again. The calculations here match month and day only. Our daily totals do not include birth times, so they cannot measure that extra coincidence.
What if the older sibling's birthday is already known?
Use the share p of that date if you want an independent-draw benchmark based on historical birthday frequencies. That gives a modeled chance p for one other child to match it. A common date and a leap-day birthday have different weights.
| Known birthday | One other matches | Two others both match | At least one of 22 others matches |
|---|---|---|---|
| September 9 | 0.3024% | 0.000915% | 6.45% |
| July 4 | 0.2162% | 0.000467% | 4.65% |
| December 25 | 0.1617% | 0.000262% | 3.50% |
| February 29 | 0.0613% | 0.000038% | 1.34% |
The "one other matches" column answers the two-child question with the first date known. The "two others both match" column asks whether two additional children both share the known date. That calculation is p² under independence.
February 29 needs particular care. The historical weight combines birth records across leap and non-leap years; it is not the probability for a birth in a specified future year. A February 29 delivery is impossible in a non-leap year. The birthday checker shows historical birth shares, rather than forecasts for a family.
What about a family with three or more children?
If any two children can form the matching pair, more children create more possible comparisons. Under the same independent models, the benchmark changes with the number of separate births:
| Separate births | Classic any pair | Historical any pair |
|---|---|---|
| 2 | 0.274% | 0.274% |
| 3 | 0.820% | 0.822% |
| 4 | 1.636% | 1.638% |
| 5 | 2.714% | 2.718% |
These are modeled independent birthdays labeled for the family question, not probabilities measured from family records. A result for "any pair" is also different from all three children sharing one date. The three-person probability guide explains that stricter event.
If one birthday is fixed, the probability that at least one of m independent others matches it is 1 − (1 − p)^m. Use the birthday paradox guide for a match anywhere in a larger group.
Why can't we give the actual sibling probability?
The Berkeley probability notes define independence: knowing one event does not change the chance of the other. Applying that assumption to siblings requires evidence about families. It does not follow simply because the children were born in different years.
Our source provides a date, weekday, and daily birth total. It has no family links, sibling identifiers, or delivery histories. Different relationships between sibling dates could produce the same nationwide date totals. An actual family rate would require linked records, a defined population and time period, and a clear treatment of multiple births and birth years.
The independent benchmark is still useful for understanding the arithmetic behind a coincidence. It should not be presented as a forecast for an individual pregnancy or proof of how rare a particular family's story is.
Data and assumptions
The historical model uses U.S. birth counts compiled by FiveThirtyEight: CDC/NCHS 1994 through 1999, then SSA 2000 through 2014 without overlapping years. It gives each of 366 dates its recorded birth share, including February 29. Both source coverage and independence limit the interpretation.
The methodology describes the historical data. Download the model results, or see the two-person explanation for the general pair calculation.