The 15 actual Thanksgivings in U.S. SSA records from 2000 through 2014 averaged 7,346.5 births per holiday. Nearby Thursdays in the same years averaged 12,830.7. That's 42.7% fewer births on Thanksgiving by this comparison. The holiday count was lower in all 15 years.
In OPM's 2026 holiday schedule, Thanksgiving is Thursday, November 26. The Friday after is November 27. The historical records do not measure 2026 births.
What happened across Thanksgiving week?
Thanksgiving moves between November 22 and 28. We compared each actual Thanksgiving with the Thursdays one and two weeks before and after it. For Wednesday before and Friday after, we used nearby Wednesdays and Fridays, respectively. Each row therefore has a comparison from the same weekday.
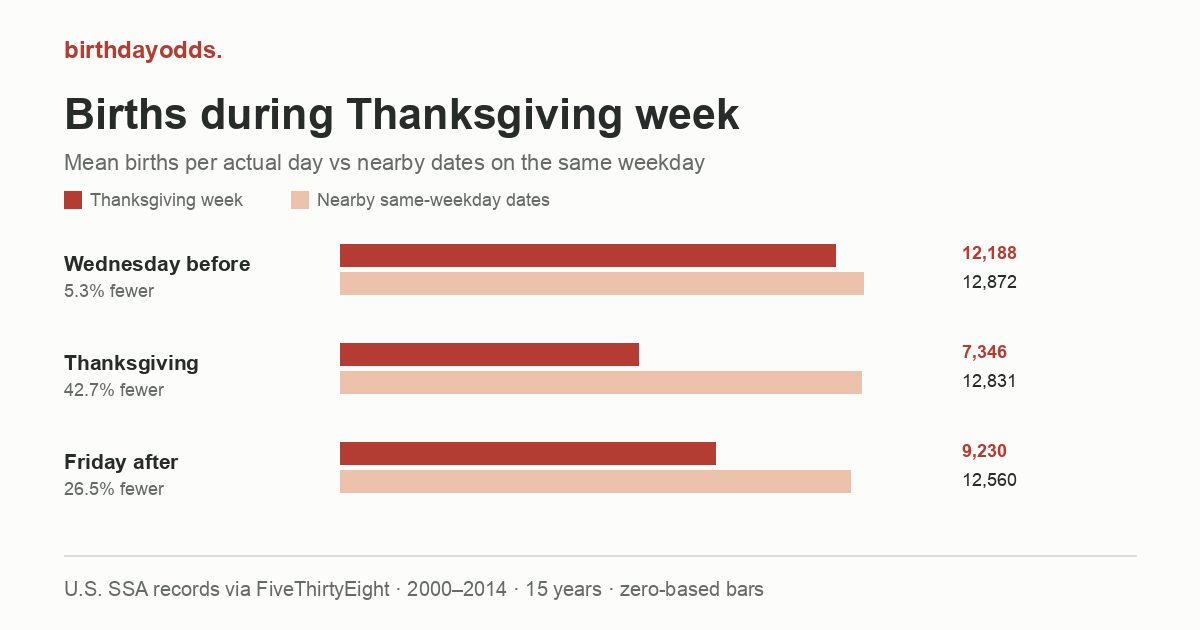
View the full-size comparison chart if the labels are small on your screen.
| Day | Mean recorded births | Nearby weekday mean | Below controls |
|---|---|---|---|
| Wednesday before | 12,188.1 | 12,872.5 | 5.3% |
| Thanksgiving Thursday | 7,346.5 | 12,830.7 | 42.7% |
| Friday after | 9,229.7 | 12,559.8 | 26.5% |
Friday after Thanksgiving averaged 9,229.7 births, 26.5% below nearby Fridays. Wednesday before averaged 12,188.1 births, 5.3% below nearby Wednesdays. The table gives the control average for each day, so you can see the size of the gap as well as the percentage.
How did each year compare?
The lower Thanksgiving count appears in every year of this 15-year series. The date changes, so the table follows the holiday rather than treating one November date as Thanksgiving in every year.
| Year | Thanksgiving date | Recorded births | Control mean | Below controls |
|---|---|---|---|---|
| 2000 | 2000-11-23 | 8,144 | 12,869.3 | 36.7% |
| 2001 | 2001-11-22 | 7,513 | 12,529.3 | 40.0% |
| 2002 | 2002-11-28 | 7,392 | 12,661.8 | 41.6% |
| 2003 | 2003-11-27 | 7,340 | 12,639.8 | 41.9% |
| 2004 | 2004-11-25 | 7,614 | 13,046.3 | 41.6% |
| 2005 | 2005-11-24 | 7,267 | 13,191.3 | 44.9% |
| 2006 | 2006-11-23 | 7,521 | 13,721.5 | 45.2% |
| 2007 | 2007-11-22 | 7,567 | 13,875.3 | 45.5% |
| 2008 | 2008-11-27 | 7,126 | 13,019.5 | 45.3% |
| 2009 | 2009-11-26 | 6,864 | 12,706.0 | 46.0% |
| 2010 | 2010-11-25 | 7,162 | 12,786.0 | 44.0% |
| 2011 | 2011-11-24 | 6,894 | 12,294.8 | 43.9% |
| 2012 | 2012-11-22 | 7,267 | 12,446.3 | 41.6% |
| 2013 | 2013-11-28 | 7,175 | 12,406.8 | 42.2% |
| 2014 | 2014-11-27 | 7,351 | 12,267.5 | 40.1% |
A November 27 birthday is a different question: that date includes Thanksgiving in some years and other weekdays in others. The November birthday guide ranks all 30 fixed dates in the month.
Does the comparison change with different Thursdays?
Using only the Thursdays one week before and after gives 43.4% fewer births on Thanksgiving. The Thursdays two weeks away give 42.0% fewer. Two control dates coincided with Veterans Day; leaving them out gives 42.8% fewer. The gap is large under all three choices.
These percentages compare the sum of holiday births with the sum of each year's control average. They do not count births that were prevented or moved to another date. Nearby weekdays make a closer comparison than adjacent calendar dates, but they cannot remove every seasonal or hospital-level difference.
Why might Thanksgiving births be lower?
The SSA data give daily counts, not delivery methods, hospital schedules, or families' decisions. A separate NBER study using California records found evidence that some births are retimed around major holidays. It uses a different population and method; we cannot assign its explanation to the Thanksgiving gap in these nationwide counts.
Our study of four fixed-date holidays asks a related question. Thanksgiving needs its own calculation because its date changes each year. You can also check a birthday against the full historical ranking.
Sources and method
We used daily U.S. SSA birth counts compiled by FiveThirtyEight, covering 62,187,024 recorded births on 5,479 days from 2000 through 2014. The U.S. Office of Personnel Management defines Thanksgiving as the fourth Thursday in November. We used that date each year, then averaged its four nearby Thursday controls before combining years. The analysis data contain every date, birth count, control, and calculation.
These historical counts are not a prediction for a future Thanksgiving or a worldwide estimate. The methodology explains the source's coverage.
For a fixed date that sometimes falls on the holiday, read November 27 birthdays. The Memorial Day study follows another moving U.S. holiday.
The November 29 study compares the latest possible Friday after Thanksgiving with other November 29 dates. Its fixed-date question differs from this moving-holiday study.